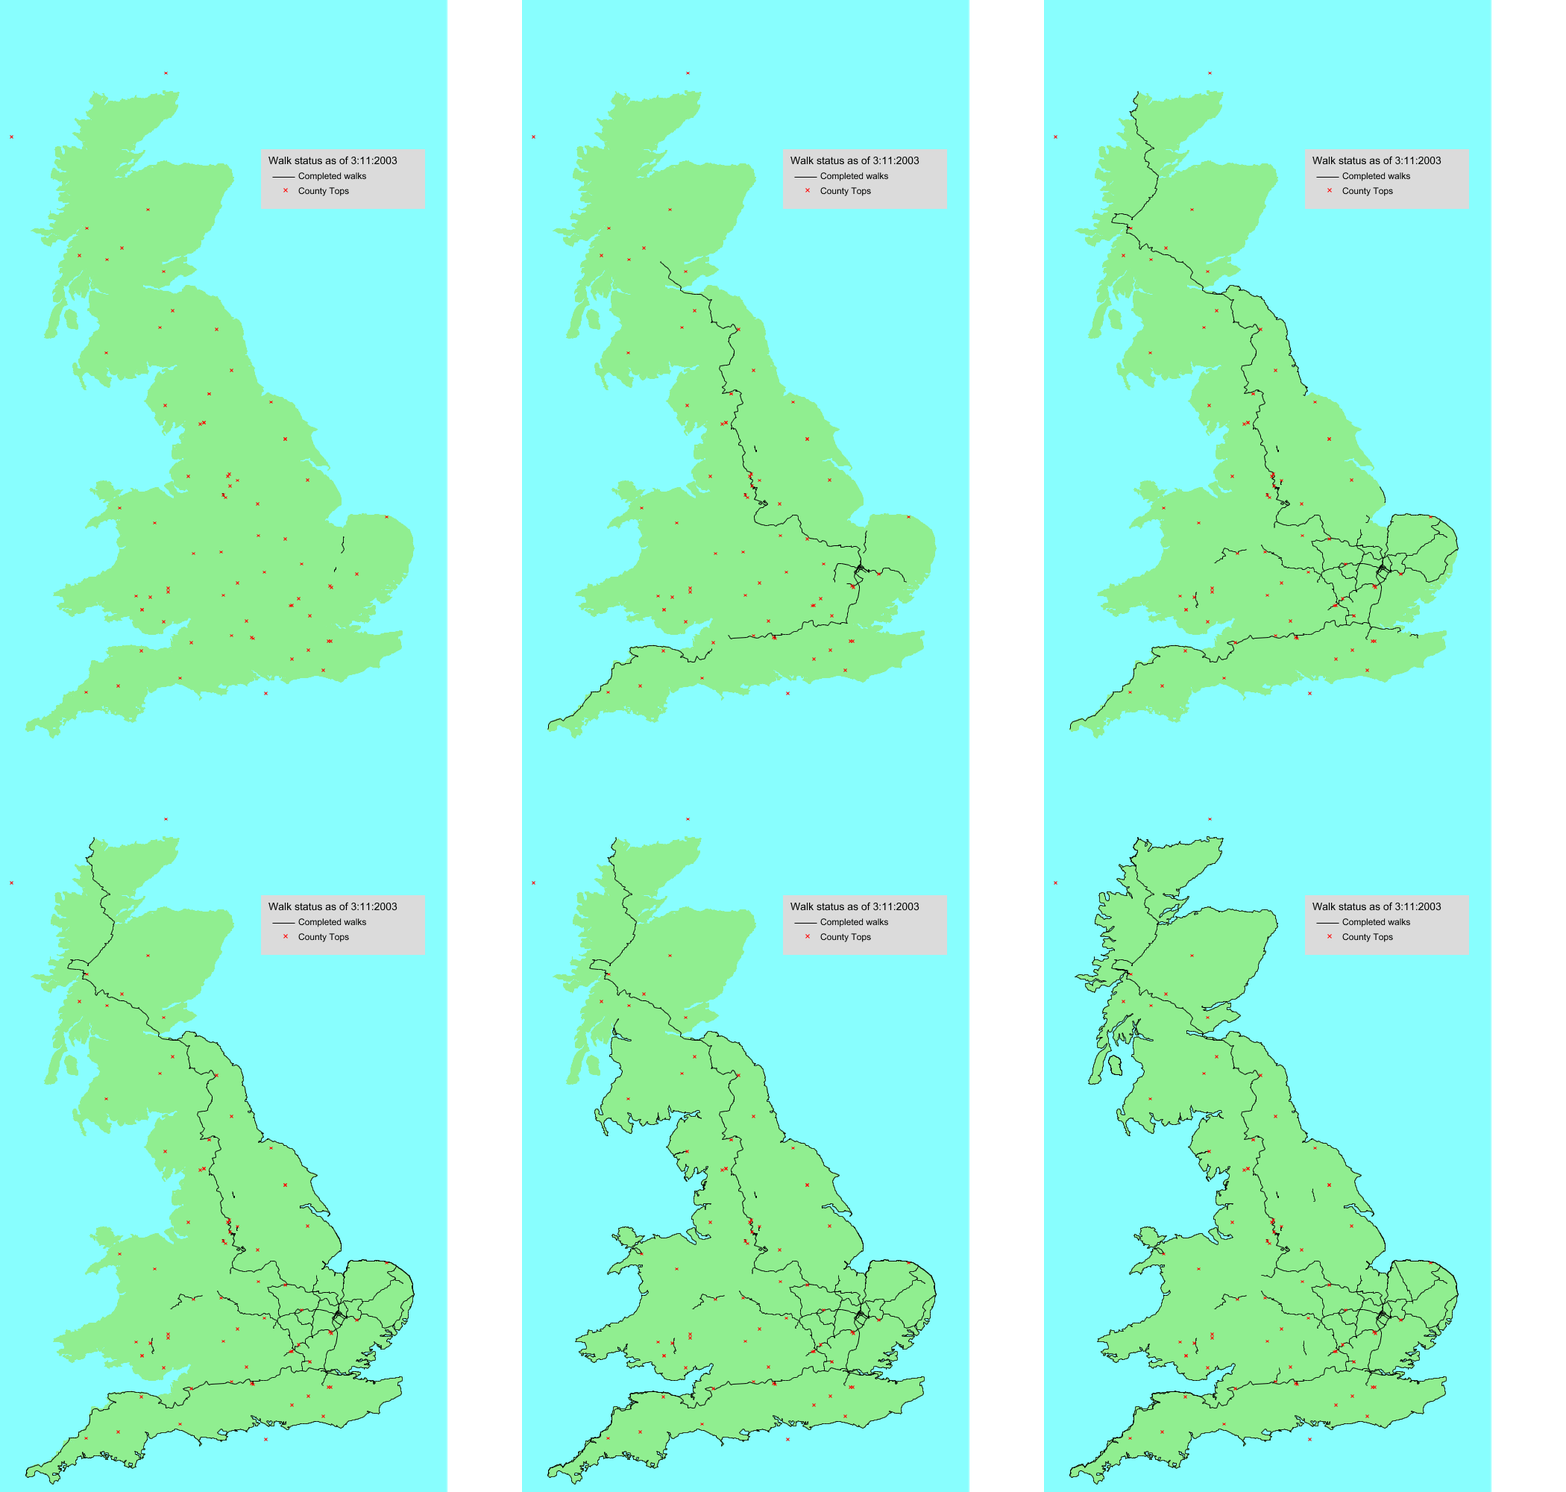
Below is an animated gap (63kBytes) that shows all the walks that I have done since the beginning of 1999, in chunks of six day's walking.

During all the walks that I have done since the beginning of 1999 I have regularly (usually every twenty minutes) recorded my position according to GPS. I have then generated a PERL script that reads those locations and plots a Scaled Vector Graphics (SVG) file from the data. One of these maps can be seen on the main index page by anyone with an SVG viewer, such as the one from the Adobe website.
Also on my PC I have a suite of JAVA programs called Batik that perform various procedures on SVG files. One of these is a Rasterizer, which I use to convert the vector SVG files into a more common bitmap PNG file.
A perl script generates a seperate SVG file for every six days walking walked, and these are numbered 6,12,18 etc. A command line script then runs the Batok rasterizer for each of these files to conver them into PNGs.
I then use the JASC Software Animation Shop 3 package (part of the Paint Shop Pro 7 distribution) to convert the PNG images into an animated GIF, with the result that you see here.
I would like to be able to increase the number of frames in the animation by decreasing the number of new walks per frame from six to three or four. Unfortunately the Animation Shop 3 package runs out of memory if I do this, and so until I invest in more memory for my PC it shall have to remain at the rather large step of six walkes per frame, which makes the animation jerky.
Another option is to do exactly the same thing using an SVG file. SVG does allow animations of this sort, but I have yet to investigate how I could do this from my PERL scripts. Another downside to this is the fact that the browser plugin needed to view SVG files is uncommon, whilst virtually every modern browser allows PNG files to be viewed.
|
|
|